Juanita

Analytics Engineering | Data Analystics |
Data Engineering | Business Analytics |
Business Intelligence |
╔═════════════════════════╗
SQL | Python | dbt | Snowflake
Big Query | Tableau | Excel | R
▬▬▬▬▬▬▬▬▬▬▬▬▬▬▬▬▬▬▬
📡 Communicating findings and key metrics to inform others
▬▬▬▬▬▬▬▬▬▬▬▬▬▬▬▬▬▬▬
📚 Data Storytelling 🌿 Climate Learning
🐕 Analytics Informed Dog Mom
╔═════════════════════════╗

Visualizing Sports Analytics With Tableau 
Sports analytics came up in popularization, in part, by the real-world success illustrated by the 2003 book and 2011 motion picture Moneyball. Decision-making metrics can help teams on-field from which players to draft, trade, improve in-game strategies and nutrition plans to off-field to help monitor ticket and merchandise sales, improve fan engagement, and reduce operational costs. It uses data to measure areas like athletic performance and business health to optimize the processes and success as a whole - of a sports organization.
Traditionally decisions were made by instinct - complying with old traditions, newspapers, trading card scores, television and radio media commentary. Advancements in technology, analytics evolution with sports teams allow analysts to use various tools, like predictive analytics, machine learning, data mining, and virtual simulations.
For this case study, I do some visual exploratory analysis with Tableau as a data analyst with a basketball sports team.
A few questions with this analysis include:
What position is the most efficient at shooting 3-pointers for every team?
How did different players score on total points, total assists, and total rebounds?
What are the total points scored by each team, and how did players on the team score?
What players had the most assists in every position?
Key Insights
🏀 The best Position overall is the Shooting Guard (SG) and the worst is the Center (C).
🏀 Trae Young is the point guard with the highest assists and points.
🏀 The team with the highest points is the Minnesta Timberwoves, and the lowest is Oklahoma City Thunder.
🏀 Positions highest number of assists PG 737, C 584, PF 388, SG 379, last SF 358
Data Details
The sports data is from the basketball reference website. The data includes 813 rows and 31 columns. The data set consists of string and numeric data types. Some columns include Rank, Games Played, Games Started, Minutes Played, Field Goals Made/Attempted, FG%, 2/3Pointers Made/Attempted, 3P%, 2P%, and so on.
The data will have to be manipulated depending on whether visualizing the team statistics or the individual player statistics. The data includes all player statistics, including when traded to different teams denoted by TOT descriptor.
Analysis
As a data analyst interviewing for a role on an NBA team, the first technical task is assigned by the assistant coach of the team. They want to know - what position is the most efficient at shooting 3-pointers for every team? One way to do this is using an XY Heatmap. It is a good way of showing the patterns between the two categories of data - in this case, the average 3-point percentage (3P%) and Position (POS).
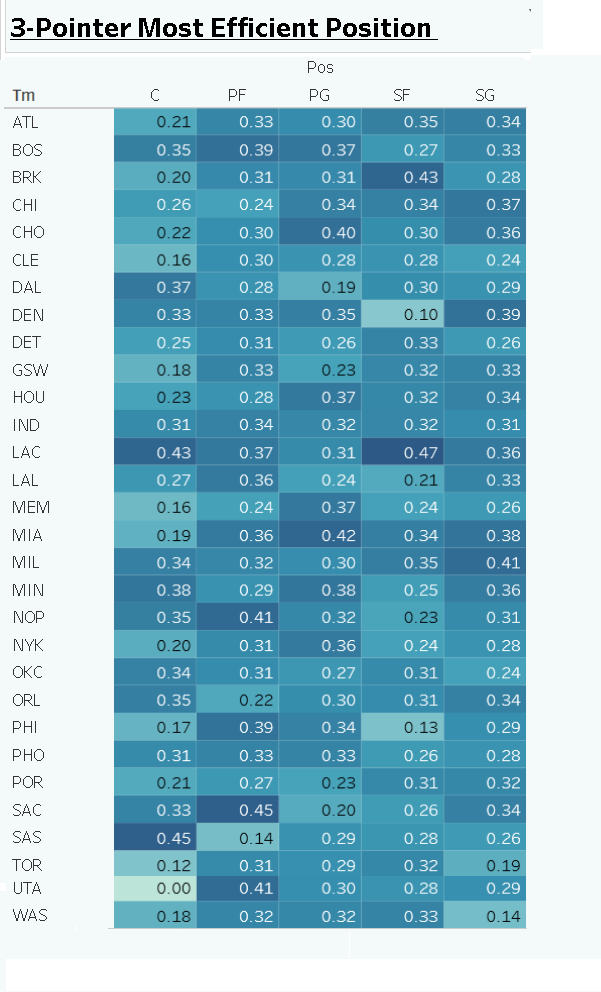
The darker color squares signals a higher efficiency, while lighter colors signal lower to no efficiency for that position. For these teams this season, it seems the best Position overall is the Shooting Guard (SG) with a 0.313103448275862 average, and the worst is the Center (C) with a 0.26448275862069 average. The highest team average for a Position is LA Clippers, with a 0.47 for the Small Forward. In contrast, the lowest team average is for Utah Jazz, with a 0.00 for the Center.
For the next part of the interview process, my task is to create a visualization of how different players performed last season for evaluation for potential free-agent signings. The panel mentioned, ‘We’d like to see how players did on total points, total assists, total rebounds, and evaluate by position.’ Thinking about the requirements for the task, first, I take note of the data types requested: three numeric (quantitative) variables: assists, points, rebounds, and one nominal (qualitative) variable: positions. To do this, I use a bubble plot. It is a scatterplot (X & Y axes) but adds third-dimension detail by sizing the circles according to a third variable. All the three are numerical variables.
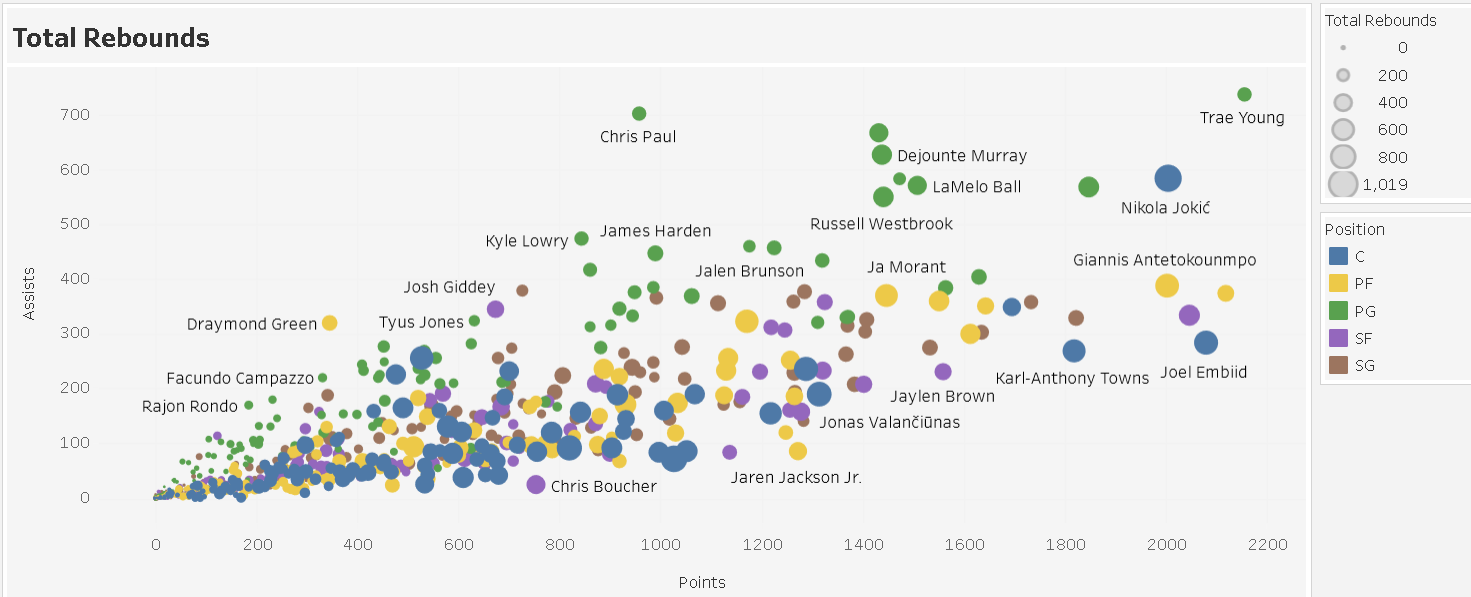
Power Guards (green bubble) are higher on the chart compared to other positions - more assists. It also has the widest range in points from around 50 to close to 2200. Trae Young is the point guard with the highest assists (737) and points (2155). Nikola Jokic is the center that has the highest total rebounds (1019). The highest assists for Power Forward, Shooting Guard, and Small Forward tend to max out around 300 to 400.
The panel has one additional requirement; to see the total team points scored and individual players score for the different teams in the NBA. For this task, I will use a stacked bar chart. The stacked bar chart shows how a single entity - is broken into component elements (part-to-whole relationships). Noting it can be hard to read with several components. If the target audience is interested exclusively in the size of the components magnitude-type chart should be considered.
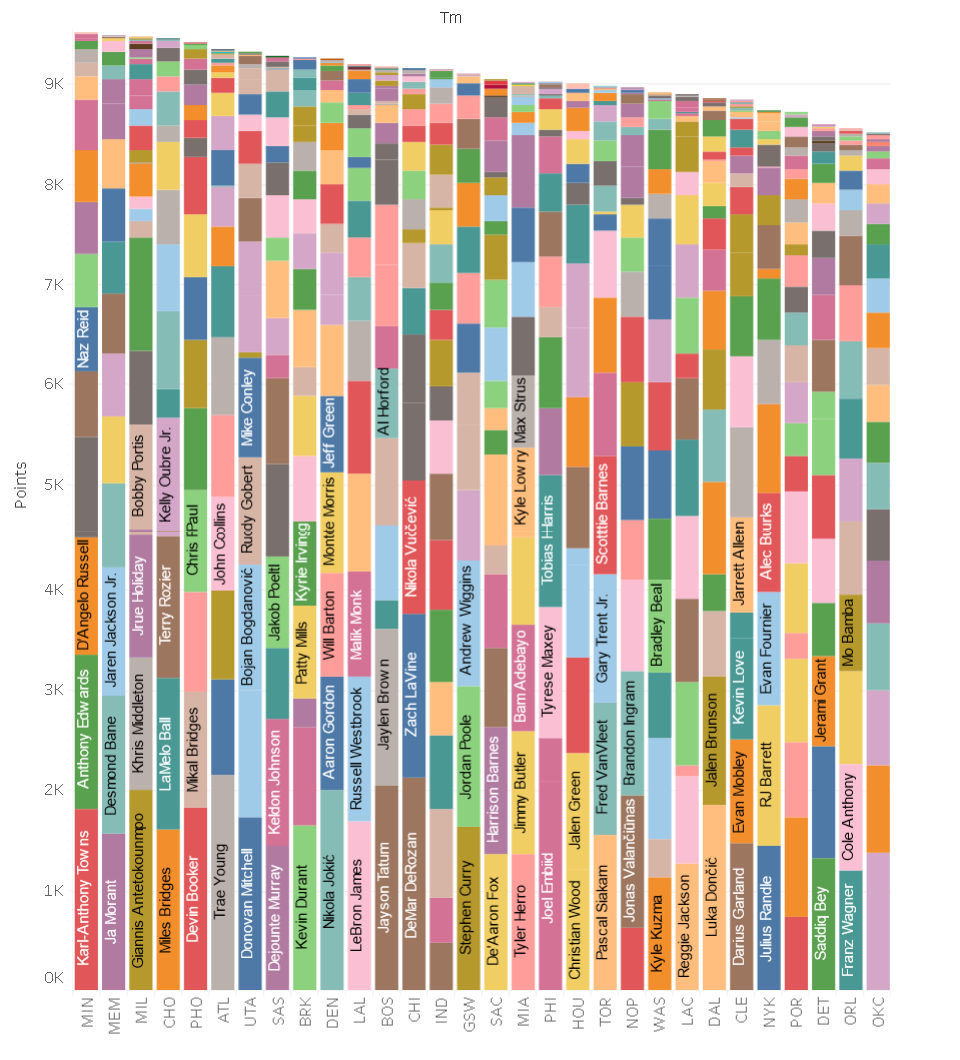
The team with the highest points is the Minnesota Timberwolves (over 9000), and the lowest is Oklahoma City Thunder (around 8700). The individual players that stand out are DeMar DeRozan (Chicago Bulls), Jason Tatum (Boston Celtics), Trae Young (Atlanta Hawks), and Joel Embiid (Philadelphia 76ers).
The last task for the interview comes from the team’s general manager - a visualization that helps them evaluate the league market in assists. They want to improve the team’s assist numbers for this upcoming 2022-2023 season. They want to know which players had the most assists in every position. This task also requires a visualization that shows part-to-whole relationships or hierarchical structures. This last visualization task can be achieved, in many ways, but I would like to display this task using a treemap visualization. Treemaps are a more compact option for displaying proportions via their area size, which gives a quick overview of the hierarchical structure.
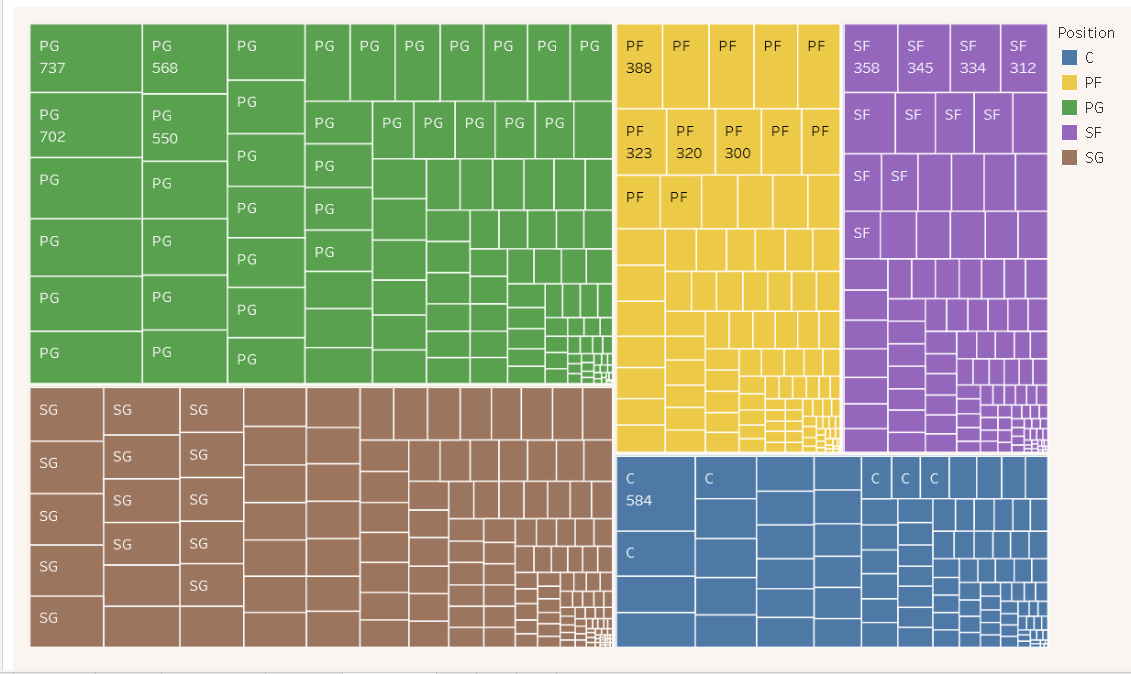
The Point Guard with the highest number of assists is Trae Young 737 assists. The Shooting Guard with highest AST points is Tyrese Haliburton, 379 from Sacramento Kings. The Power Forward with the highest number of assists is Giannis Antetokounmpo 388. The Small Forward with the highest number of assists is Khris Middleton 358, Both Forwards are from the Milwaukee Bucks. The last on the list is the C (Center) - with 584 Assists from Nikola Jokic (Denver Nuggets).
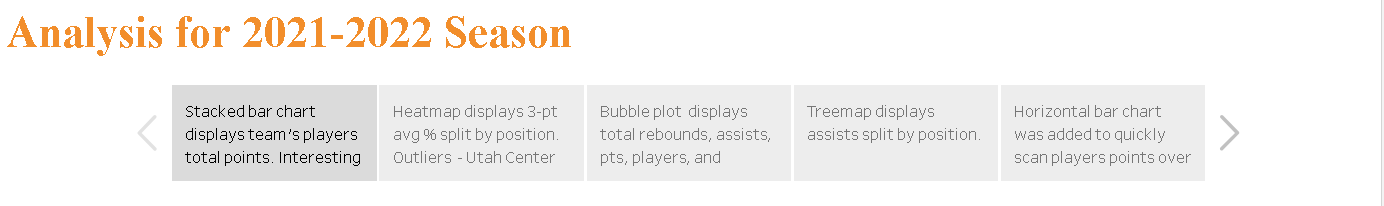
I created a Tableau story - summarizing the tasks completed during the interview.
Observations and Insights
- The best most efficient Position for shooting 3-pointe overall is the Shooting Guard (SG) with a 0.313103448275862 average, and the worst is the Center (C) with a 0.26448275862069 average.
- Trae Young is the point guard with the highest assists (737) and points (2155). Nikola Jokic is the center that has the highest total rebounds (1019).
- The team with the highest points is the Minnesta Timberwolves (9,983), and the lowest is Oklahoma City Thunder (around 870) for the 21-22 season.
- Positions with highest number of assists - Point Guard 737 (Trae Young), Center 584 (Nikola Jokic), Power Forward 388 (Giannis Antetokounmpo), Shooting Guard 379 (Tyrese Haliburton), and Small Forward 358 (Khris Middleton).